 PI Market
Fequently Asked Questions
During the Appraisal/Calculator process you must select a Location. The general rule of thumb is all PI materials are accepted at the Alliance Home System.
Any system that is opened up for contract acceptance outside of the Home System will incur a small Freight Fee to cover the cost of moving the goods to the correct system.
This fee is clearly shown on both the pre-offer screen and the post-offer screen
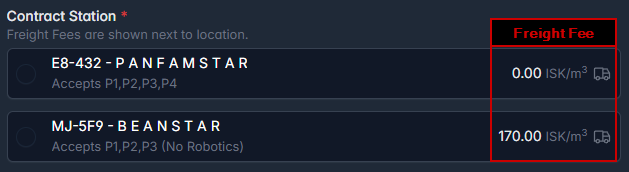
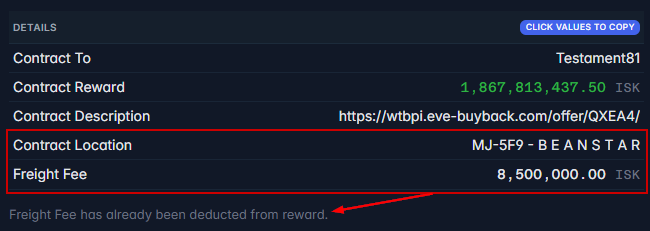
The Freight Fee is automatically deducted from the reward. The reward listed is the reward you put in the contract, you do not need to deduct the freight fee yourself.
Our offered price will definitely not be the same as any other servie or API you may use. Just like all markets in Eve Online the PI Commodity market is very volatile and prone both to natural market flux and flux created by market manipulation. Take a look for yourself on one of the many sites that offer historical graphs or just the in game history, you will see lots of 'peaks' and 'valleys' as market flux occurs. Every peak and valley is a potential gain or loss depending on your strategies.
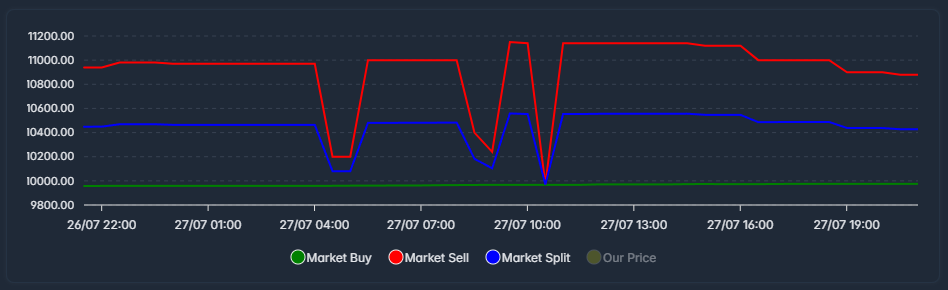
Lets strip it down to just the raw market Split price, if you take a look at the min and max for a 24 hr period you get a big window of prices, now you have to find the exact time to get the price you want. Lowest price was approx 9,969 ISK and highest was 10,558, while that doesn't seem like much that is one unit. When you are selling thousands of units those difference can add up to profits and loss.
How do we combat flux?
We use an average price based on the prices over the last 24 hours. Eve Online updates the market data every 30 mins, we snapshot that data every 30 mins and use it to calculate an average price.
For example, here is 3 hours of data points
| Time | Split Price | Our Price |
|---|---|---|
| 1430 ET | 1,000 ISK | |
| 1400 ET | 1,400 ISK | 1,140 ISK |
| 1330 ET | 2,000 ISK | 940 ISK |
| 1300 ET | 2,000 ISK | 740 ISK |
| 1230 ET | 500 ISK | 1040 ISK |
| 1200 ET | 500 ISK | 1240 ISK |
In this pretend scenario our system is using a 2.5 hour price model. Which means we should have a total of 5 price points (2.5 hrs * 2 points an hour = 5 Points) You'll notice that the 1430 ET 'Our Price' is empty, that is because it is now 1430 ET, don't look at the clock, trust me. Our system just pulled the Jita 4-4 price and determine the Split Price is 1,000 ISK right this second. (3 hours of data now).
Now that we have a new price point, we need to use the historic data to generate new pricing. To do this we AVERAGE the last 5 price points (2.5 hours of pricing).
(1400 + 2000 + 2000 + 500 + 500) / 5 = 1280 ISK
Now we can fill in the 'Our Price' for our latest data which is 1430 ET. This will be the price we use to valuate all goods in or out until a new price is determined in 30 minutes. We drop the last oldest price, so the end result would look like this.
| Time | Split Price | Our Price |
|---|---|---|
| 1430 ET | 1,000 ISK | 1,280 ISK |
| 1400 ET | 1,400 ISK | 1,140 ISK |
| 1330 ET | 2,000 ISK | 940 ISK |
| 1300 ET | 2,000 ISK | 740 ISK |
| 1230 ET | 500 ISK | 1040 ISK |
| 1200 ET | 500 ISK | 1240 ISK |
Will I loose ISK?
We won't even lie, that could happen. If you are basing your numbers off other tools and their prices then sometimes it will look like you are loosing money. If you are constantly dealing with us then most times you are ending up in a better position.
For example, look at the 1430 data point in the above table, Market Split is 1,000 ISK but our price is 1,280 ISK
There could also be times it's lower as in the 1330 data point in the above table.
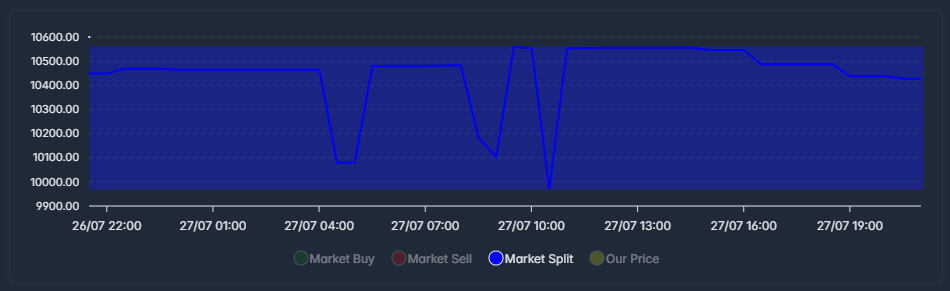
Min-Maxing is great in TTRPGs and lots of other things, but in a volatile market it's very hard to do, with the price model we use you get a more stable price that is less prone to extreme market peaks and valleys. Let us look 'Our Price' for the Consumer Electronics table we saw earlier.
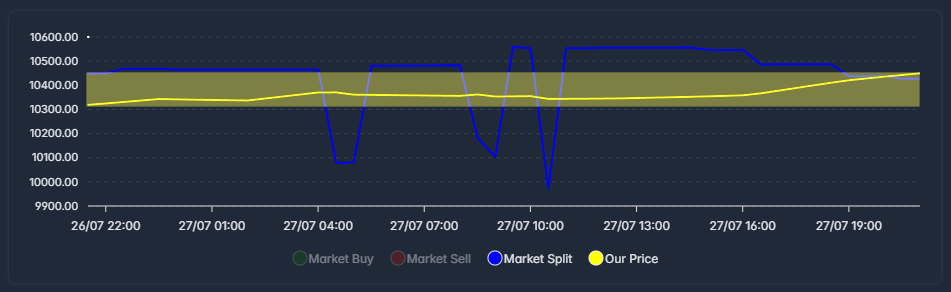
Look at the yellow bar, that is your price range for the 24 hours, much less movement than the big red bar in the previous graph. What does this mean to you? Stable pricing, less flux, better profits.
I don't trust this
You don't have to trust it, take a look for yourself! All the data we use to create the price is available for you to see for yourself at What can I sell?. Simply click an item to view the associate data and graph.